WHAT IS A BEARISH ENGULFING PATTERN?
A bearish engulfing pattern produces the strongest signal when it appears at the end of an uptrend. The pattern is created by interpreting the data of two completed candles:
The image below depicts the bearish engulfing pattern appearing at the bottom of a downtrend.

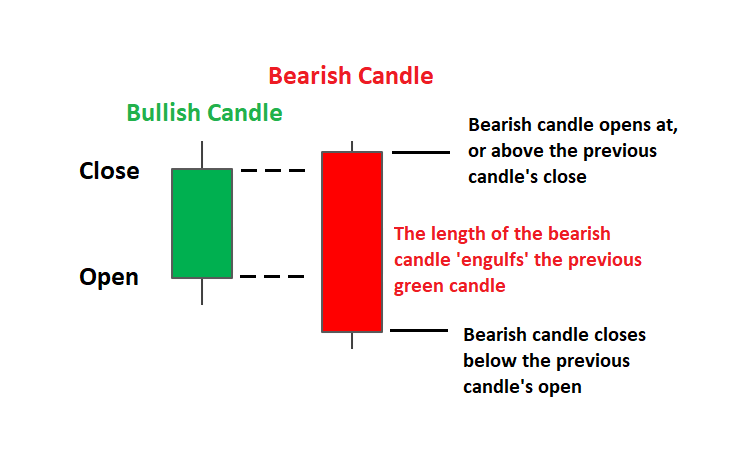
The following image focuses on the bearish and bullish candles that constitute the bearish engulfing pattern.

The first candle will depict the end of the established trend strength. It should be noted the size of this primary/bullish candle can vary but it is crucial that the body of this candle gets completely ‘engulfed’ by the candle that follows. Dojis and other small bullish candles provide the strongest signal as they can reflect market indecision in the current trend.
The second candle in the pattern is the reversal signal. This candle is comprised of a long red candle creating fresh downward price momentum. This bearish candle should open above the close of the previous candle and close well below the low of the previous candle. This strong downward movement reflects sellers overtaking buying strength and often precedes a continued fall in price. The further this secondary/ bearish candle declines, the stronger the signal becomes.
| ENGULFING PATTERN | CHARACTERISTICS | LOCATION | SIGNAL |
| Bearish Engulfing | Red candle engulfs previous (smaller) green candle | Appears at the top of an uptrend | Bearish signal (Bearish reversal) |